I recently received a wonderful email from a mathematical leader at a local junior high school. She had two great questions, so I thought I’d turn my response into this short blog post. I separated her questions with my responses.
Read on…
1.) How do we connect the Concrete and Representational to the Abstract in our percentages unit? How do we go from finding the percent increase with the tape diagram and the ratio table to connecting it to the formula so they discover the “shortcut”?
Percent of change = amount of change / original amount
I see where the amount of change is coming from. But why do we divide by the original?
My thoughts about your Question #1
We definitely want to help students move from Concrete and Representational into the Abstract with percentages. We will do this by examining the table and looking for patterns. From these patterns, students will create a formula (in the form of x*k=y) that relates the values in the x-column with the values in the y-column. We might have to SHOW students the essential patterns that lead us to a formula.
An important thing I noticed about your question is that you used the work “the”…as in “the formula” and “the shortcut”. Looking at the standards, there is NO mention of a specific formula that students must learn in 7th grade.
To make sure I am correct, I also looked at the Progressions Document that unpacks the standards and helps us understand exactly what the standards mean. Here is the document on percentages, in which you will notice they never mention a specific percent formula that students must use for percent increase.
https://commoncoretools.files.wordpress.com/2012/02/ccss_progression_rp_67_2011_11_12_corrected.pdf
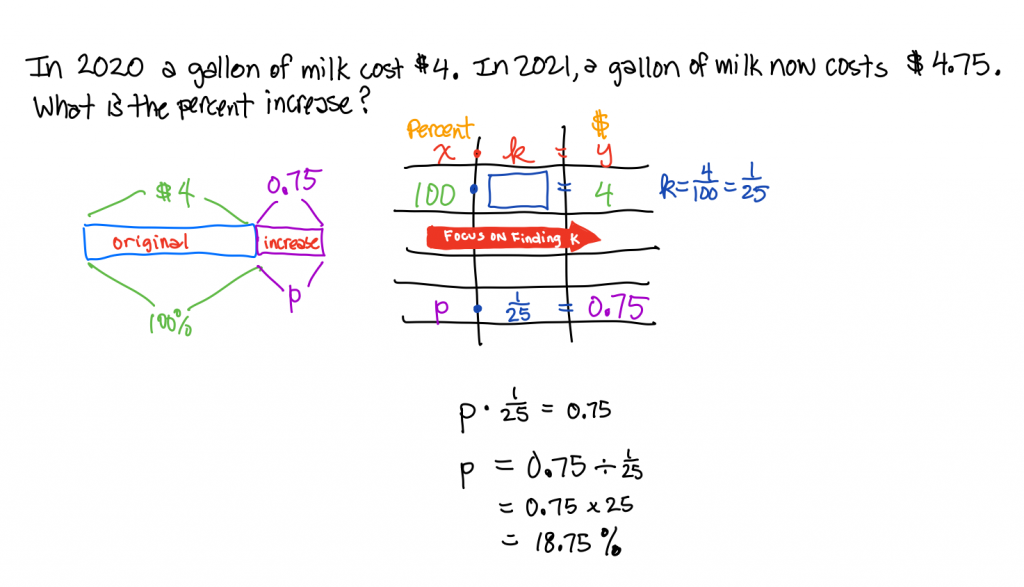
Here is a quick example for showing how students might use a formula to find the percent increase. It isn’t THE formula…it is just ONE of many options. A key feature in this example is that we want to look for a horizontal relationship between the values rather than a vertical relationship.
(A key distinction between 6th grade percentages and 7th grade percentages is that 6th graders look for vertical relationships of equivalent ratios, whereas 7th graders look for the constant of proportionality that relates the x-column values with the y-column values.)
So…we are looking for ONE formula, rather than THE formula. Nonetheless, why does THE traditional formula work?
Percent of change = amount of change / original amount
Let’s look at that same x*k=y table, but this time we won’t simplify the constant of proportionality.
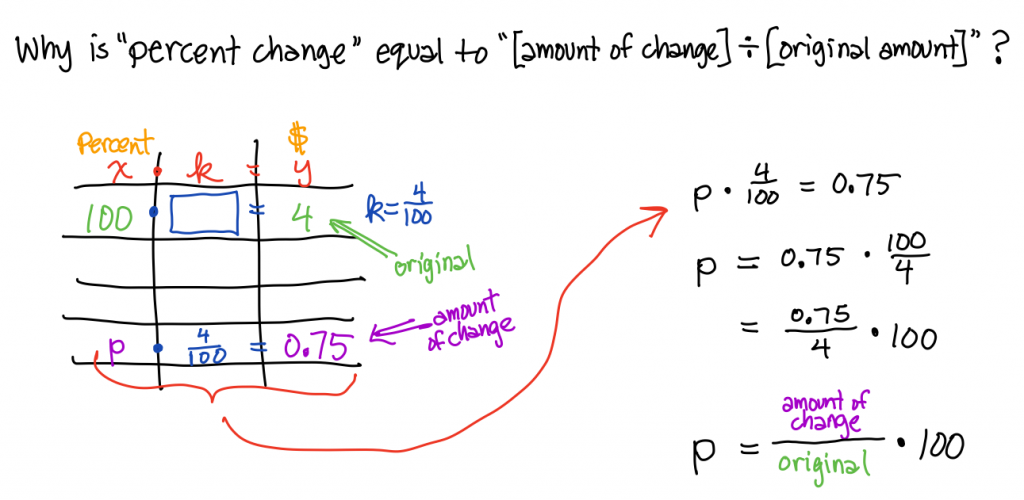
By solving for p, which is the percent increase, we derive the formula as a result.
2.) How do I help my colleagues see why using the x*k=y table is so important?
My thoughts about your Question #2
Using the x*k=y chart is incredibly important because this is EXACTLY what students will be seeing in later grade levels.
Ideally, the x*k=y chart will be used with proportions and percentages in 6th, 7th, and 8th grade.
Additionally, we use the x*k=y in 8th grade to teach linearity. In 8th grade, they will think of y=2/3x+5 as a the proportional line (y=2/3x) that is shifted up by 5 units.
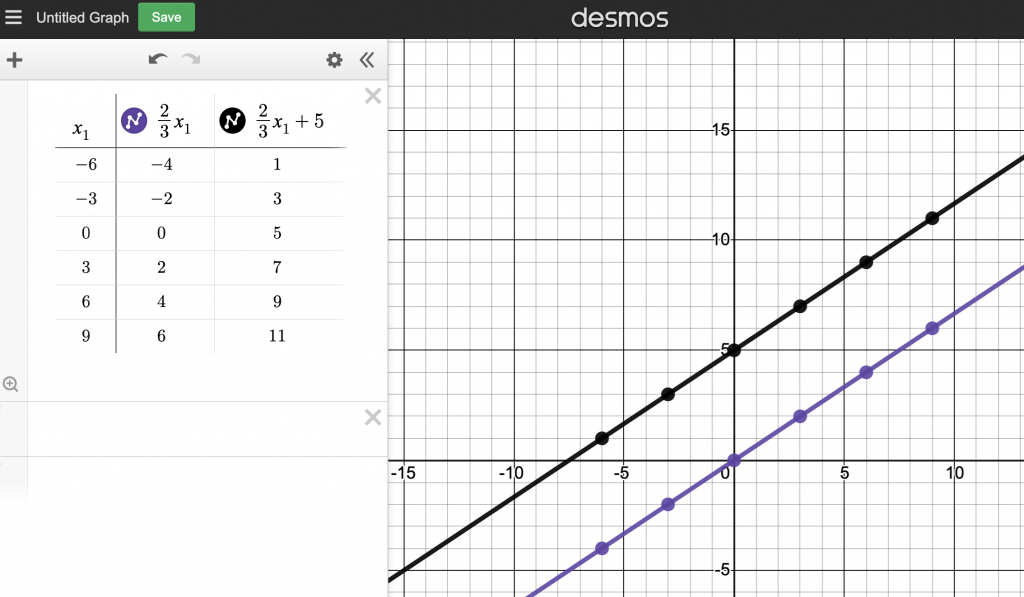
In this example, the purple line is the proportion and the black line is that proportional line shifted up by 5 units.
Well…that was my response to the email. How did I do? Did I get anything wrong or miss any important details?
.
.
.